New Mix & Mobility Equity – Putting People First

rendering on people standing in line to get on a bus

As part of the New Mix Planning and Environmental Linkages (PEL) Study, the Connecticut Department of Transportation (CTDOT) has carried out a Mobility Equity Analysis in Waterbury.

This effort explores transportation equity through several methods, including public surveys, data collection, and analysis. This process has helped the New Mix team identify the needs of the community and produce recommendations for improvements that answer those needs.

What is Mobility Equity?

The United States Department of Transportation (USDOT) describes equity in transportation (also referred to as mobility equity) as aiming to meet the needs of all community members through fairly facilitating mobility and accessibility for all transportation users1. 

Mobility equity is about putting people first–whether they walk, bike, take public transit, or use a personal motor vehicle. Mobility equity exists when all transportation users in a given community have fair access to transportation options, including convenient public transit and safe, welcoming pathways for pedestrians and bicyclists. 

What outreach was performed?

In the summer and fall of 2023, the New Mix Team launched the Mobility Equity Analysis Survey. The survey polled residents and commuters within the Greater Waterbury area for their opinions on the existing transportation system. The survey asked for user experiences related to safe, convenient, and accessible pedestrian and bicycle routes and public transit options. Participants were also asked questions about their demographics and travel patterns.

The New Mix Team also met with key stakeholders, community organizations, and transit operators. Through the outreach performed this, vital input from the public was gathered that helped shape the priorities, goals, and strategies for improving mobility equity.

Members of the New Mix Team during a community outreach event in Waterbury.

Members of the New Mix Team during a community outreach event in Waterbury.

Waterbury residents and commuters taking the Mobility Equity survey.

Waterbury residents and commuters taking the Mobility Equity survey.

What are the Mobility Equity Analysis goals?

The following goals were identified based on information obtained from the survey, stakeholder outreach, and data evaluations:


What are the strategies for meeting the goals?

  • Create comfortable and safe sidewalk routes and a network of bicycle routes connecting neighborhoods, the Waterbury Central Business District, and surrounding key destinations including existing and future recreational areas and open spaces.
  • Improve stormwater management, and wherever possible, incorporate green infrastructure (such as rain gardens, permeable pavement, and bioswales) into roadway and pedestrian rehabilitation projects, making the area more resistant to flooding and climate impacts.
  • Expand and improve weekday and weekend public transportation options within the Study Area, especially at high-ridership locations.
  • Incorporate safety countermeasures into high-crash and highly-traveled locations to improve pedestrian and bicycle safety, visibility, and comfort.

Connecting the goals to these strategies helped to form the recommendations that resulted from the Mobility Equity Analysis.

What are the Mobility Equity Analysis Recommendations?

The Mobility Equity Analysis led to a list of prioritized improvements that seek to remedy safety and infrastructure deficiencies related to pedestrians, bicyclists, and transit users within the Study Area. Each recommendation corresponds to at least one of the strategies for meeting the Mobility Equity Analysis goals. The following images show the top-three (3) recommendations. A complete list of the recommendations and detailed analysis information can be found within the Mobility Equity Analysis Technical Memorandum located at newmixwaterbury.com/Document-Library.

What are the next steps?

After the completion of the analysis, the recommendations may be incorporated into the New Mix PEL Study Preliminary Alternatives or implemented in the short term as standalone projects. 

Analysis, needs and deficiencies study graphic


How was the survey distributed?

quote from a survey drawing winner

The targeted survey distribution area was the PEL Study Area, including the Central Business District and the South End and Brooklyn neighborhoods in Waterbury. By focusing on the Study Area, the New Mix Team made it a priority to connect with the community most affected by the New Mix Project.

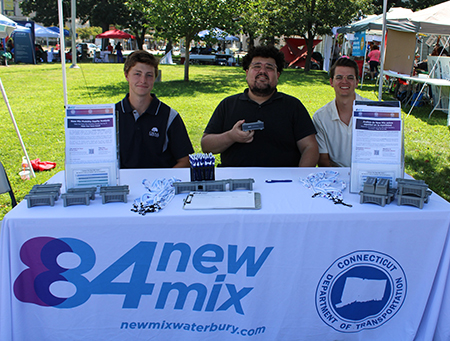
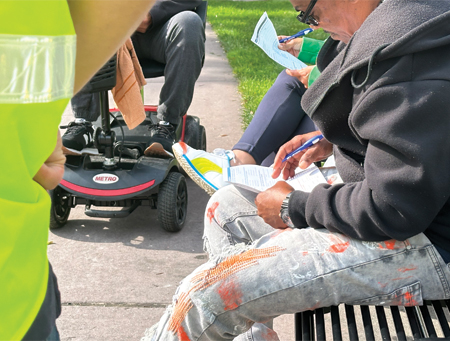
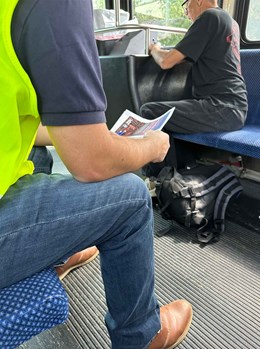
Electronic and hard copy versions of the survey were provided in both Spanish and English, with additional languages available by request. Factsheets were also developed describing activities and intended outcomes and included a QR code and instructions for the electronic survey. Factsheets and surveys were distributed throughout the Study Area at pop-up events at popular landmarks, local community events, bus and train stops, community facilities, and other locations. The New Mix Team had over 18,000 surveys and factsheets delivered directly to the homes of residents within the target area. Over 80 local businesses and commercial locations were also sent survey and factsheet information through the mail. The Waterbury Green and local Waterbury bus routes were a focus for in-person survey distribution. In-person, print, and online methods, including social media posts, were used to distribute the survey and engage the public.

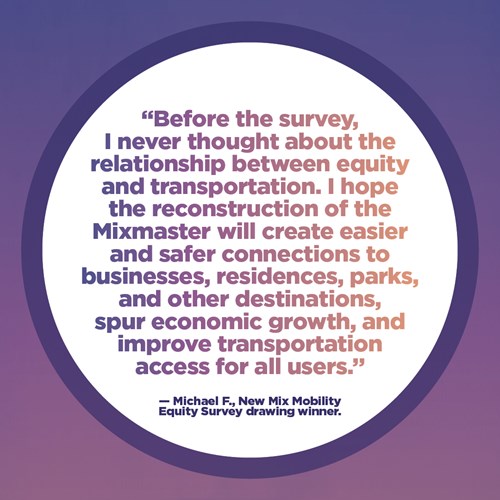
Survey respondents were offered a two-hour local Waterbury CTtransit bus pass and had the option to enter a drawing for a $100 Visa Gift Card as a token of appreciation for participating.


What did the Mobility Equity Survey ask?

person on the bus taking the survey

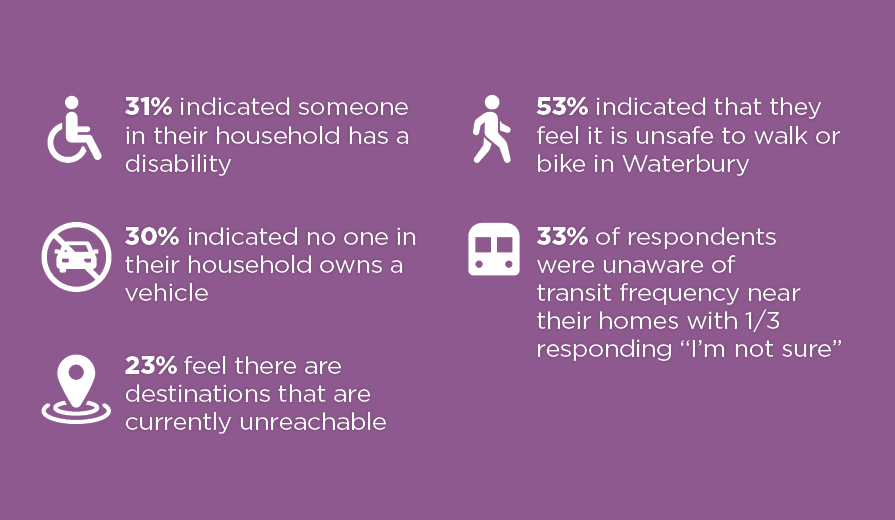
The survey asked questions related to the everyday use of the transportation system in Waterbury, the destinations people are traveling to, and their methods of travel. The questions were categorized into seven factors important to equity in transportation planning and project prioritization:

  • Demographic Information
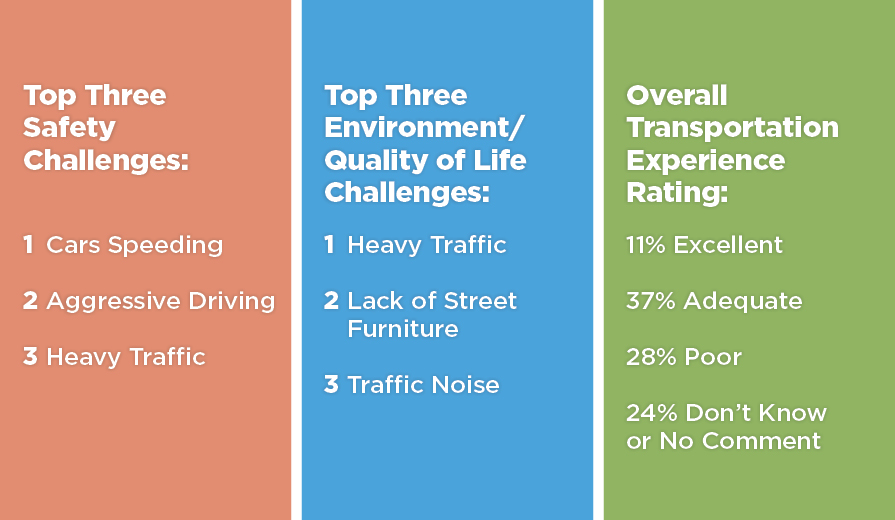
  • Safety Challenges
  • Public Transportation Challenges
  • Pedestrian and Cycling Challenges
  • Environment/Quality of Life Challenges
  • Access to Destination Challenges
  • Overall Ratings of the Transportation System 


What were the results of the Mobility Equity Survey?

The New Mix Team had a target number of responses based on the population of the study area of approximately 40,000 individuals. With a desired survey confidence level of 90% (+/- 5%), the target survey sample size was 271 surveys. The team received survey responses from 347 unique respondents, surpassing the original target. The respondents completed all or part of the 56-question survey, resulting in over 15,000 data points for analysis. More detailed survey information and results are found in the Mobility Equity Analysis Technical Memorandum. Information obtained from the Mobility Equity Survey, public and stakeholder input, and digital data evaluations were used to inform the development of the Mobility Equity Analysis Goals and Strategies.

survey results data
top safety challenges, quality of life changes and transportation experience rating